Traffic light view
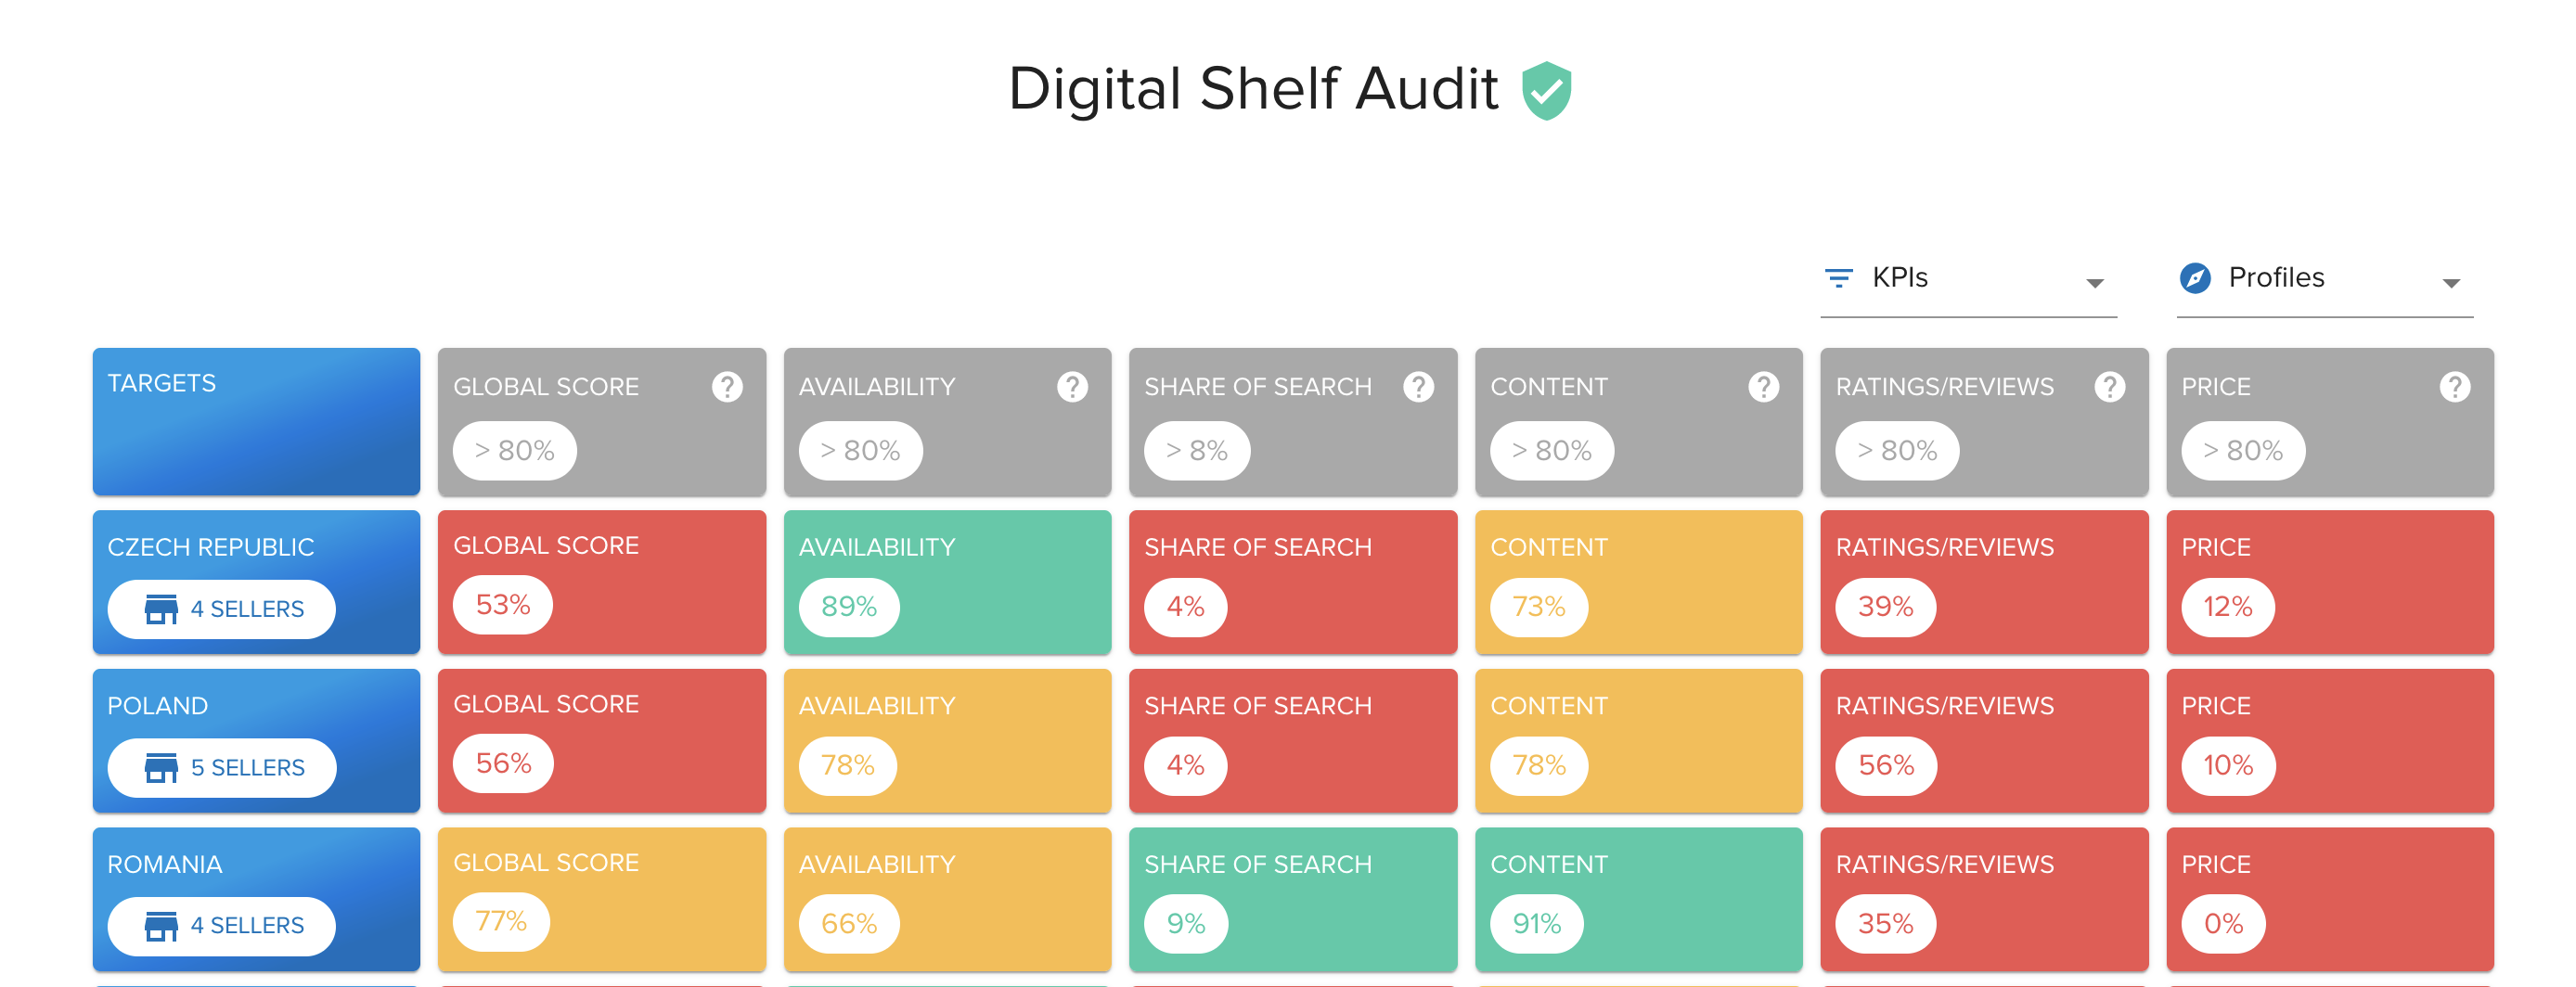 ;
;The user can see a list of his/her profiles, displayed in a grid fashion.
Each column representing a KPI, the user can immediately compare the performance of several profiles on a single KPI.
Clicking on a KPI will redirect the user the corresponding profile’s KPI page.
KPI help#
The user can access the help page related to each page by clicking the help button in front of each KPI’s name.

Selectors#
The user can filter which KPI and profiles are displayed using the selectors at the top.

sellers metrics#
Clicking on the number of sellers under each profile name will open a breakdown of the KPIs by seller.

